Results
Status: rungs 1, 2 and 3 complete. This page is updated as they land, and says plainly which numbers exist.
See Method for the design and the appendix for the machinery it assumes.
Rung 1: the pretrained prior, no labels
Spearman rank correlation on the held-out fold, ESM-2 masked-marginal scoring with no gradient updates.
| assay | scheme | 35M | 650M |
|---|---|---|---|
A4GRB6_PSEAI_Chen_2020 |
random | 0.516 | 0.725 |
| modulo | 0.488 | 0.729 | |
| contiguous | 0.237 | 0.389 | |
CCR5_HUMAN_Gill_2023 |
random | 0.353 | 0.336 |
| modulo | 0.350 | 0.275 | |
| contiguous | 0.395 | 0.327 | |
R1AB_SARS2_Flynn_2022 |
random | −0.026 | 0.113 |
| modulo | −0.073 | 0.057 | |
| contiguous | −0.077 | 0.213 |
The implementation is validated against the published benchmark
ProteinGym publishes per-assay zero-shot Spearman for every ESM-2 size. On the
random scheme, which is closest to scoring the whole assay, this pipeline
reproduces those numbers:
| assay | published, 35M | measured, 35M | published, 650M | measured, 650M |
|---|---|---|---|---|
A4GRB6_PSEAI_Chen_2020 |
0.528 | 0.516 | 0.738 | 0.725 |
CCR5_HUMAN_Gill_2023 |
0.358 | 0.353 | 0.347 | 0.336 |
R1AB_SARS2_Flynn_2022 |
−0.026 | −0.026 | 0.105 | 0.113 |
The published figures cover the whole assay while these cover a fifth of it, so exact agreement is not expected; the point is that nothing is off by a sign, a scale, or a residue. This is the only external check the design has, which is why it was run first.
Three assays, three different priors
The cohort turned out to span the range, which was not designed and is useful.
A4GRB6, a beta-lactamase: the prior is strong and scale helps a lot. 0.52 at
35M rising to 0.73 at 650M. This is the regime protein LMs are usually presented
in.
CCR5, a chemokine receptor: the prior is moderate and scale does nothing.
About 0.35 at both sizes, and at two of three schemes 650M is worse than 35M.
Nineteen times the parameters buys nothing here.
R1AB, the SARS-CoV-2 main protease: the prior is absent. −0.03 at 35M, and
still only 0.11 at 650M. ProteinGym's published table shows it does not become
useful until 3B (0.498). At the ladder's checkpoint size, rung 1 for this assay is
a floor of nothing.
That last case is worth keeping rather than replacing. An assay where the prior contributes nothing is the cleanest possible test of what labels alone buy, and it was chosen by a pre-registered rule before any of this was known. Swapping it out now, having seen these numbers, would be selection on outcome.
It is also a caution about the headline. "Fine-tuning beat zero-shot" is a much weaker claim when zero-shot was at zero to begin with, and reporting all three assays separately rather than averaging is what keeps that visible.
Scale is not monotone
Worth stating because it is easy to assume otherwise: 650M beats 35M on
A4GRB6 by a wide margin, loses to it on CCR5 at two schemes out of three, and
helps on R1AB without reaching usefulness. Whatever a bigger prior buys depends
on the protein, not on the parameter count.
Rung 2: what supervision buys at a fixed representation
324 arms: three assays, three schemes, three readouts, four label counts, three seeds. Twenty minutes on the laptop, most of it the one-off embedding pass.
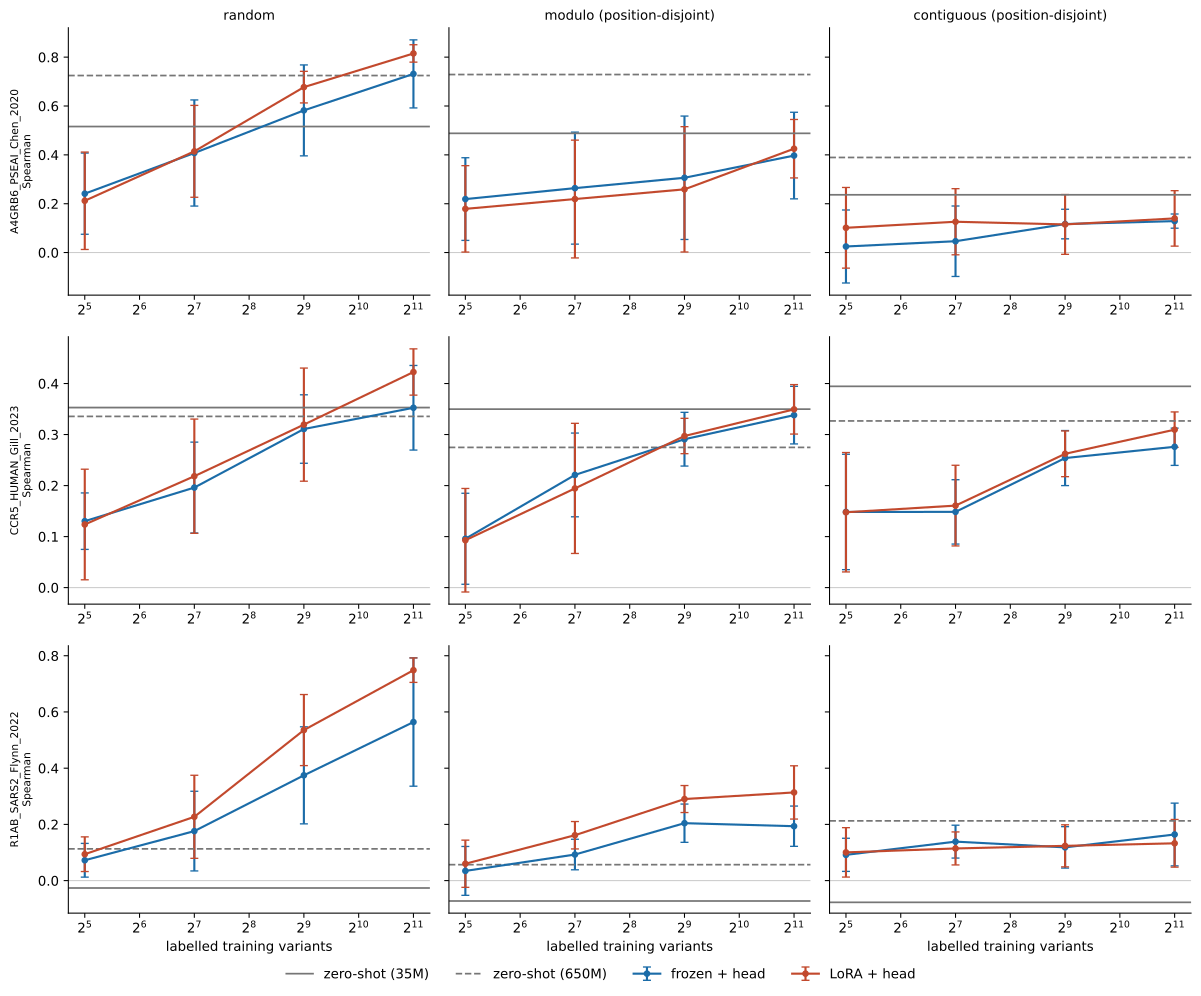
Spearman by label count, averaged over readouts and seeds, with the 35M zero-shot floor beside it:
| assay | scheme | N=32 | N=128 | N=512 | N=2048 | zero-shot |
|---|---|---|---|---|---|---|
A4GRB6 |
random | 0.231 | 0.364 | 0.528 | 0.733 | 0.516 |
| modulo | 0.219 | 0.264 | 0.304 | 0.348 | 0.488 | |
| contiguous | 0.019 | 0.021 | 0.051 | 0.100 | 0.237 | |
CCR5 |
random | 0.126 | 0.201 | 0.293 | 0.350 | 0.353 |
| modulo | 0.090 | 0.223 | 0.285 | 0.342 | 0.350 | |
| contiguous | 0.159 | 0.158 | 0.226 | 0.238 | 0.395 | |
R1AB |
random | 0.067 | 0.171 | 0.346 | 0.562 | −0.026 |
| modulo | 0.014 | 0.117 | 0.184 | 0.198 | −0.073 | |
| contiguous | 0.103 | 0.137 | 0.130 | 0.147 | −0.077 |
Supervision beats the prior only where the test sites were seen
This is the headline, and it is not the comfortable result.
On random, where training and test share almost every residue position,
supervision climbs steeply and overtakes zero-shot on all three assays. On the
two position-disjoint schemes it mostly does not. A4GRB6 under modulo reaches
0.357 against a zero-shot floor of 0.488; under contiguous it sits at 0.02
against 0.237. CCR5 under contiguous reaches 0.241 against 0.395.
The exception is R1AB, where supervision wins under every scheme, because the
prior is at zero and anything clears it.
Read together: 2,048 labels are worth a great deal when you already have data at the sites you care about, and worth little when you do not. A benchmark reporting only a random split would show the first half of that and none of the second.
The readout mattered more than the label count
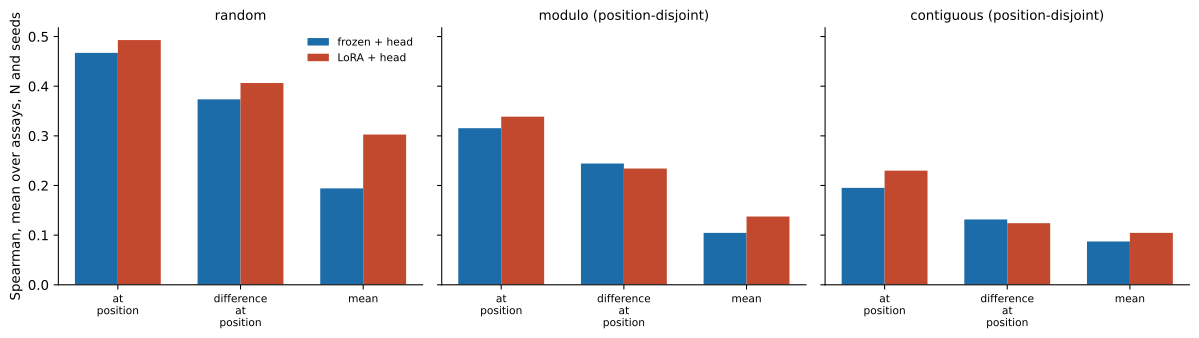
Mean over seeds at N=2048:
| assay | scheme | mean | at_position | difference |
|---|---|---|---|---|
A4GRB6 |
random | 0.548 | 0.856 | 0.795 |
| modulo | 0.048 | 0.596 | 0.400 | |
| contiguous | 0.067 | 0.102 | 0.131 | |
CCR5 |
random | 0.249 | 0.425 | 0.374 |
| modulo | 0.295 | 0.366 | 0.366 | |
| contiguous | 0.181 | 0.243 | 0.291 | |
R1AB |
random | 0.244 | 0.750 | 0.693 |
| modulo | 0.085 | 0.296 | 0.212 | |
| contiguous | 0.029 | 0.260 | 0.152 |
Mean pooling is worst or joint-worst in every one of the nine cells, often by
a factor of two or more, and by twelve times on A4GRB6 under modulo (0.048
against 0.596). That is the readout the field reaches for by default and the one
this pipeline would have used if the parameter had been given one.
This is the clearest vindication of a design decision in the project. Making the readout a pre-registered axis rather than a knob cost three times the rung-2 compute, which was twenty minutes, and the alternative was reporting roughly half the achievable performance while believing it was a property of protein language models.
at_position wins six cells outright, difference_at_position two (both under
contiguous), and they tie on one. So there is no single best readout either,
which is the other reason not to have selected one.
Site coverage, not label count, is what saturates
Each arm records how many distinct residue positions its training draw covered.
For R1AB:
| scheme | N=32 | N=128 | N=512 | N=2048 |
|---|---|---|---|---|
| random | 30 | 107 | 251 | 303 |
| modulo | 30 | 91 | 171 | 181 |
| contiguous | 30 | 96 | 172 | 181 |
The position-disjoint schemes cap at 181 sites however many labels are drawn,
because the training folds only contain that many. random reaches 303. That is
the mechanism behind the flat curves above: past N=512 the extra labels are
repeat measurements at sites already covered, not new sites.
Recording this was worth it. Without it, A4GRB6 under contiguous sitting at
0.02 across every label count reads as a broken pipeline rather than as a model
that has seen 181 of 266 sites and cannot transfer to the remaining block.
Rung 3: adaptation buys nothing a converged frozen baseline does not
The full grid: 324 configurations, 3 assays x 3 schemes x 3 readouts x 4 training sizes x 3 seeds, on an L40S. Every run produced a result, no NaN, adapters attached in all of them (184,320 trainable parameters), and early stopping fired everywhere, between 11 and 110 epochs against a 200 cap.
The naive comparison, and why it is not the answer
When rungs 2 and 3 were first compared, LoRA gained +0.0399 Spearman (p=8.6e-5, 69% of configurations). That number was not attributable to fine-tuning: rung 2 trained at batch 256 / lr 1e-3 and rung 3 at batch 8 / lr 1e-4, and patience is counted in epochs, so an epoch was 5x (N=32) to 25x (N=2048) more gradient updates on rung 3. 14.8% of rung-2 runs stopped at or before epoch 2. The rungs shared a stopping constant, not a stopping rule.
Both supervised rungs now read one batch size and one learning rate (issue #33), and rung 2 has been re-run. The delta shrank by about a quarter:
| mean Spearman | |
|---|---|
| rung 2, old optimiser | 0.2236 |
| rung 2, shared optimiser | 0.2348 |
| ridge, converged floor | 0.2619 |
| LoRA | 0.2634 |
| paired contrast | mean | p |
|---|---|---|
| LoRA − rung 2, old optimiser | +0.0399 | 8.6e-5 |
| LoRA − rung 2, shared optimiser | +0.0287 | 0.002 |
| rung 2, shared optimiser − ridge | −0.0271 | 0.107 |
Eleven rung-2 runs are lower bounds. With the smaller batch, 11 of 324
rung-2 configurations reach the 200-epoch cap while still improving, with best
epochs of 189 to 199; nine of them are the mean readout. No rung-3 run hits the
cap. Those eleven numbers therefore understate rung 2 and would, if anything,
inflate the delta. They do not: excluding them moves it from +0.0287 to +0.0292
(p=0.0007). Worth stating because the truncation lands exactly on the readout
where the head is already weakest.
The confound is smaller and not gone. Rung 2 is still 0.027 below a ridge
regression on the identical features, so it is still not converged and the
residual delta cannot be cleanly attributed either. The reason has changed,
though: it is no longer an optimisation-budget difference. Broken out by readout,
ridge beats the rung-2 head by +0.104 on mean, +0.009 on at_position, and
loses by 0.031 on difference_at_position. That is one badly-conditioned readout
rather than a general under-fit, and the rung-2 head carries no explicit weight
decay. Tracked as issue #35.
A converged frozen baseline recovers the entire gain
frozen_reference.py
fits ridge regression on the same cached embeddings, the same splits, the
same subsample draws, choosing the penalty on the same validation fold rung 2
selects its epoch on. Ridge has a closed-form solution, so it cannot be
under-fit. It is not a fourth rung; it is the answer to "how much of the delta is
the frozen representation, fit properly?"
| contrast | mean | Wilcoxon p | wins |
|---|---|---|---|
| LoRA − rung 2 as published | +0.0399 | 8.6e-5 | 69% |
| ridge − rung 2 as published | +0.0383 | 0.017 | 57% |
| LoRA − ridge | +0.0015 | 0.28 | 59% |
Mean Spearman across all 324: rung 2 (as published) 0.224, ridge 0.262, LoRA 0.263.
Against a properly-fit frozen representation, LoRA buys nothing on average. The apparent +0.040 is the size of rung 2's under-fit, not the value of adaptation. That is the headline of this rung, and it is a negative result.
What does survive: the split, not the adaptation
LoRA beats ridge on exactly one scheme, and it is the one that lets the model see the test positions during training:
| scheme | LoRA − ridge | p | LoRA − rung 2 (shared optimiser) | p |
|---|---|---|---|---|
fold_random_5 |
+0.0195 | 0.032 | +0.0557 | <0.001 |
fold_contiguous_5 |
+0.0071 | 0.96 | +0.0148 | 0.30 |
fold_modulo_5 |
−0.0219 | 0.86 | +0.0154 | 0.50 |
Both columns say the same thing: whatever advantage adaptation has is confined to
the split that lets it see the test positions. Against the trained head the
overall delta is +0.0287 and significant, but scheme by scheme only random
survives.
The paired scheme contrast random − modulo is +0.049 (p=0.0022). Under
fold_random_5, folds share almost every residue position, and predicting each
test variant by the mean measured score of its position in the training pool
alone reaches Spearman 0.80, 0.43 and 0.80 on the three assays. Under the
position-disjoint schemes that predictor is undefined, because position overlap
is exactly zero by construction. So there is a large, purely positional signal
available under random and none under the other two, and adaptation is where
the model picks it up.
Caveats that belong with these numbers
Three assays. The 108 seed-averaged configurations rest on 3 assays and 3
test folds per scheme, and the per-assay deltas change sign. Under a bootstrap
clustered by assay, only random excludes zero: contiguous [−0.011, +0.073],
modulo [−0.013, +0.078], random [+0.029, +0.115]. The effective sample size
for any scheme-level statement is nearer 3 than 36.
The two disjoint schemes do not disagree. Comparing each to zero gives
contiguous p=0.017 and modulo p=0.57, which invites a story about why they
differ. Paired, contiguous − modulo is +0.008, p=0.52. There is nothing to
explain, and reading two p-values as a difference is a mistake this page made in
draft.
contiguous carries a label-distribution shift that modulo does not, since
its folds are contiguous position blocks. Zero-shot scoring, which involves no
training and so cannot leak, already differs by 0.25 Spearman between the two
schemes on A4GRB6_PSEAI_Chen_2020. That bounds how much any cross-scheme
comparison can mean.
The readout ordering depends on the baseline. Against rung 2 as published,
the mean readout appeared to benefit most from adaptation (+0.080). Against
ridge it is the worst (−0.051), while difference_at_position is the best
(+0.036, p<0.001). Rung 2 has since been re-run with the shared optimiser (see
above), and the ordering does not change: ridge still beats the rung-2 head by
the most on mean (+0.104) and the least on difference_at_position, where the
head wins (−0.031). The mean readout is where the rung-2 head is worst
conditioned, not where LoRA helps: a mean-pooled 480-dimensional vector over a
300-residue protein differing at one position is badly conditioned, and dropout
and early stopping alone do not resolve it without weight decay, tracked as
issue #35.
What this rung is waiting on
Rung 2 has been re-run with rung 3's optimiser (issue #33), so an epoch-count
difference can no longer buy the two rungs different optimisation budgets. The
delta that survives is smaller and no longer attributable to that confound.
What is left is a regularisation gap between the rung-2 head and a converged
ridge fit, concentrated in the mean readout, tracked as issue #35.
frozen_ridge.csv stays as a permanent sanity floor regardless: it costs
seconds once the embeddings are cached, and it is the check that surfaced both
of these.
The cost estimate was wrong, and validation was why
Issue #11 estimated roughly 7 GPU-hours for the 81-job array, where a job ran
the whole N curve for one (assay, scheme, readout, seed). That figure counted
training passes and ignored validation entirely. Issue #20 later settled the
job granularity the other way: the SLURM array submits one task per
configuration, 324 of them rather than 81, so that a preempted task costs one
configuration instead of a whole curve. Total GPU-hours are unchanged either
way; see the experiment log for that decision.
ProteinGym's folds are ~1,000 to 1,270 variants each, and the fine-tuned rung re-encodes the whole validation fold every epoch. At N=32 that is validating on thirty times more data than training on, and validation becomes about 90% of the run. The first smoke attempt was killed after eleven minutes without finishing a single N=128 configuration.
Validation is now subsampled to 256 variants, fixed per assay and scheme and
independent of N and seed, and applied to both supervised rungs so model
selection stays identical and the ladder still differs in exactly one thing.
Re-running rung 2 under the cap moved nothing that matters: A4GRB6 random at
N=2048 went 0.734 to 0.733, R1AB 0.577 to 0.562. 256 variants are plenty for
choosing a stopping epoch.
With the cap, one N=128 configuration takes 442s on MPS. Extrapolating over the full N curve gives about 1.8 hours per (assay, scheme, readout, seed) on this laptop, so roughly 143 MPS-hours, or 10 to 18 GPU-hours on an L40S depending on the speedup that hardware actually delivers. The jobs are independent, so wall-clock is far less than that.
The revised figure is worth stating plainly rather than quietly correcting: the original estimate was optimistic by roughly a factor of two, and the reason was a cost the estimate never modelled.