4The Data: What Each Assay Measures
Every model in this book learns from a surprisingly short menu of experiments. A protein language model reads amino-acid strings; AlphaFold reads sequence and writes coordinates; a regulatory-genome model reads DNA and writes a stack of signal tracks. Before any architecture makes sense, you need to know what each experiment actually measures, what its numbers mean, and whether a given readout is something the model reads in or something it is asked to predict. This chapter is the data primer: it defines the load-bearing assays and, at the end, threads each one to the model that consumes it. Keep the genetics primer (Chapter 5) nearby, since several of these readouts only make sense against the biology it covers.
4.1Sequence, structure, and fitness
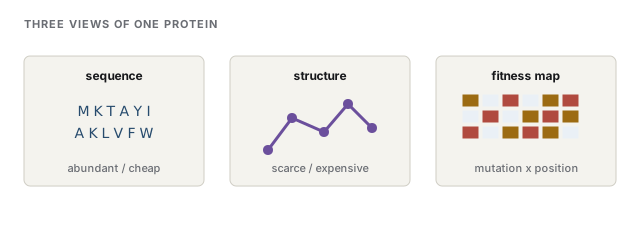
Start with the three faces of a single molecule, ordered by how much data exists for each.
Sequence is abundant and cheap. A protein is a string over a 20-letter alphabet (the amino acids); a genome is a string over a 4-letter alphabet (the DNA bases A, C, G, T). UniProt, the reference database of known protein sequences, holds hundreds of millions of entries, and the clustered version (UniRef) is what protein language models such as ESM-2 train on. On the DNA side, a reference genome is one agreed-upon consensus sequence for a species (GRCh38 is the current human build), against which everyone else's genome is described as a set of differences. Sequence is the substrate: it is nearly free to read, so there is enough of it to pretrain large models by self-supervision (Chapter 3).
Structure is precious and scarce. The 3D shape a protein folds into is measured, atom by atom, by X-ray crystallography (shining X-rays through a crystallized protein and inferring atom positions from the diffraction pattern) or cryo-electron microscopy (cryo-EM, imaging flash-frozen molecules with an electron beam). These structures are deposited in the Protein Data Bank (PDB), which holds well over 230,000 entries. That sounds like a lot until you compare it to the hundreds of millions of known sequences: structure is orders of magnitude rarer because each one is slow and expensive to solve. That scarcity is the whole reason AlphaFold matters, and we return to it in the structure chapter (Chapter 8).
Fitness is the label for "does this variant work?" Deep mutational scanning (DMS) is the workhorse here: you build a library containing many mutant versions of a protein, put them all under a selection pressure (say, bind a target or survive), and then sequence the surviving pool. A variant that got more common was beneficial or tolerated; one that vanished was deleterious. The result is a fitness map, an effect score for potentially every single-amino-acid substitution in the protein. ProteinGym, the standard benchmark, aggregates over 2.5 million such measurements across 217 substitution assays (Notin et al., 2023). When you read "the model predicts variant effects," DMS data is usually the ground truth it is scored against, a thread we pick up in property prediction (Chapter 7).
Intuition
Sequence is the input almost everywhere; structure and fitness are the expensive answers we wish we could read off the sequence directly.
4.2Reading the regulatory genome
Only about 2% of the human genome codes for protein. The rest includes the regulatory machinery that decides when and where each gene turns on, and a different family of assays reads it out. Each one measures a specific physical quantity along the genome, and confusing them is the most common beginner mistake.
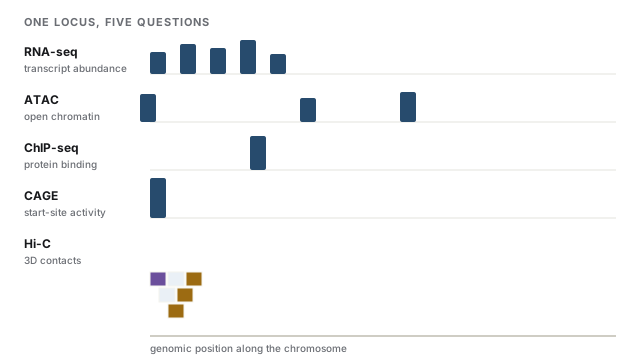
- RNA-seq measures transcript abundance: how many RNA copies of each gene are present in a sample, which is the standard proxy for how strongly that gene is expressed. Its single-cell version, scRNA-seq, gives you that expression profile per individual cell rather than averaged over a tissue.
- ATAC-seq and DNase-seq measure chromatin accessibility: which stretches of DNA are physically open and reachable rather than wound up tight. Open regions are where regulatory proteins can dock, so accessibility marks candidate regulatory elements.
- ChIP-seq measures protein-DNA binding: it pulls down a specific protein along with the DNA it was gripping, then sequences that DNA to map where a particular transcription factor binds, or where a given histone modification (a chemical mark on the DNA-packaging proteins) sits.
- CAGE measures transcription start site (TSS) activity: it captures the exact base where transcription begins and how much starts there, sharpening the fuzzy "expression" signal into a precise on-switch location.
- Hi-C measures 3D contacts: which far-apart stretches of DNA physically touch when the genome folds inside the nucleus, revealing that an enhancer megabases away can loop over to control a gene.
The unifying output form is a coverage track: a number for (almost) every position along the genome, one track per experiment per cell type. Large public consortia produced these at scale, and their names recur throughout the book: ENCODE and FANTOM5 for regulatory tracks, GTEx for tissue-level RNA-seq, and 4D Nucleome for Hi-C. One more assay to know is the massively parallel reporter assay (MPRA), which measures the enhancer activity of thousands of short synthetic DNA snippets at once by wiring each to a readout gene, giving a designed, causal test rather than an observation of the natural genome.
Collaborator
"RNA-seq gives me one expression number per gene. Why does the model predict a whole wiggly track instead?" Because position matters. A coverage track keeps the shape of the signal across the locus, so the model can learn splicing, alternative start sites, and where within a gene the signal concentrates, all of which a single per-gene number throws away. Borzoi predicts RNA-seq coverage at fine 32-bp resolution to recover that structure (Linder et al., 2025).
4.3From assay to training signal
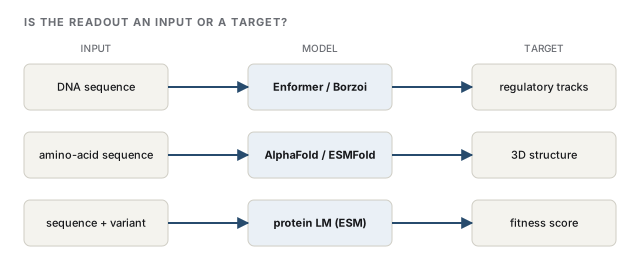
Now make the thread explicit, because the same assay plays opposite roles in different models. The organizing question is always: is this readout an input the model reads, or a target it predicts?
- DNA sequence in, regulatory tracks out. Enformer takes a long DNA window and predicts thousands of tracks at once (CAGE, ATAC/DNase, ChIP-seq) (Avsec et al., 2021); its successor Borzoi adds fine-grained RNA-seq coverage at 32-bp resolution, four times sharper than Enformer, as a target (Linder et al., 2025). The sequence is the input; every assay from the previous section is a label. We devote the sequence-to-function chapter (Chapter 12) to this family.
- Amino-acid sequence in, structure out. AlphaFold2 reads a protein sequence (with an alignment of its evolutionary relatives) and predicts atomic coordinates, trained against the PDB (Jumper et al., 2021); AlphaFold3 extends this to complexes of proteins, nucleic acids, and small molecules (Abramson et al., 2024). Here structure is the target the model buys with cheap sequence.
- Sequence in, fitness out. A protein language model trained only to predict masked amino acids assigns a likelihood to any variant; that likelihood, with no labels at all, correlates with the DMS fitness maps in ProteinGym (Notin et al., 2023). The assay is not an input here either; it is the held-out yardstick.
The lesson is that a modality is not intrinsically "input" or "output." RNA-seq is a target for Borzoi but could be a model's input elsewhere (say, to predict cell type). What fixes the role is the modeling question, not the assay. When you meet a new model, the first thing to pin down is which readouts flow in and which it is graded on, a habit that pays off again in evaluation (Chapter 16) and when the data gets messy (Chapter 15).
Collaborator
"You said Enformer predicts expression well. Will it tell me why my patient's expression differs from the reference?" Be careful. These models predict variation across genes impressively, but they explain inter-individual variation, the differences between two people's genomes, poorly, and often get even the direction of a variant's effect wrong (Huang et al., 2023). Cross-gene skill and personal-genome skill are different tests; the field passes the first far better than the second, an open problem we revisit in variant-to-mechanism (Chapter 13).
Common trap
Chromatin accessibility (ATAC) is not expression (RNA-seq). Open DNA marks where regulation can happen; transcript counts measure what did happen. A region can be accessible and silent, or an enhancer can loop in from far away, so treating one as a stand-in for the other will mislead you.
References
- Abramson, J., Adler, J., Dunger, J., Evans, R., Green, T., Pritzel, A., Ronneberger, O., Willmore, L., et al. (2024). Accurate structure prediction of biomolecular interactions with AlphaFold 3. Nature.
- Avsec, Z., Agarwal, V., Visentin, D., Ledsam, J. R., Grabska-Barwinska, A., Taylor, K. R., Assael, Y., Jumper, J., et al. (2021). Effective gene expression prediction from sequence by integrating long-range interactions. Nature Methods.
- Huang, C., Shuai, R. W., Baokar, P., Chung, R., Rastogi, R., Kathail, P., & Ioannidis, N. M. (2023). Personal transcriptome variation is poorly explained by current genomic deep learning models. Nature Genetics.
- Jumper, J., Evans, R., Pritzel, A., Green, T., Figurnov, M., Ronneberger, O., Tunyasuvunakool, K., Bates, R., et al. (2021). Highly accurate protein structure prediction with AlphaFold. Nature.
- Linder, J., Srivastava, D., Yuan, H., Agarwal, V., & Kelley, D. R. (2025). Predicting RNA-seq coverage from DNA sequence as a unifying model of gene regulation. Nature Genetics.
- Notin, P., Kollasch, A. W., Ritter, D., van Niekerk, L., Paul, S., Spinner, H., Rollins, N., Shaw, A., et al. (2023). ProteinGym: Large-Scale Benchmarks for Protein Fitness Prediction and Design. NeurIPS Datasets and Benchmarks Track.
Check yourself
Questions a sharp collaborator might ask on this chapter. Pick an answer to see whether it holds up.
-
A collaborator hands you an ATAC-seq track and asks which genes are highly expressed in the sample. What is the correct response?
Accessibility marks where regulation can happen, not what was transcribed. A promoter can be open yet transcriptionally silent, so accessibility and expression are correlated but distinct measurements. ChIP-seq is the assay for protein binding and Hi-C for 3D contacts, which the distractors conflate. -
In Enformer and Borzoi, what is the relationship between DNA sequence and the RNA-seq / ATAC / CAGE readouts?
These are sequence-to-function models: one DNA window in, thousands of coverage tracks out, trained against measured ENCODE/GTEx data. The key habit is that a modality's role depends on the question; RNA-seq is a target here but could be an input in a model that predicts cell type from expression. -
Why is experimentally determined 3D structure a far scarcer training resource than protein sequence?
The supply gap is experimental, not legal or computational: solving one structure by X-ray or cryo-EM is expensive and slow, so the PDB (~220k) trails known sequences (hundreds of millions) by orders of magnitude. That scarcity is exactly the gap AlphaFold was built to close by predicting structure from abundant sequence. -
A protein language model trained only to predict masked amino acids, with no fitness labels, still scores well on ProteinGym. What does this show?
Evolution already filtered sequences for fitness, so a model that learns the statistics of natural proteins assigns lower likelihood to deleterious variants without ever seeing an effect label. Here the assay is the evaluation, not the input, illustrating that the same DMS data is a target in one setup and a benchmark in another. -
Enformer predicts expression across many genes impressively. A statistician asks whether it will explain why two patients differ in expression of the same gene. What is the honest answer?
Cross-gene skill and personal-genome skill are different tests, and current models pass the first far better than the second, sometimes mispredicting the sign of a cis-variant's effect. The models can accept individual sequences; the failure is in accuracy on inter-individual differences, an open problem for variant interpretation.